
Why Trap Number Is the Most Overlooked Factor
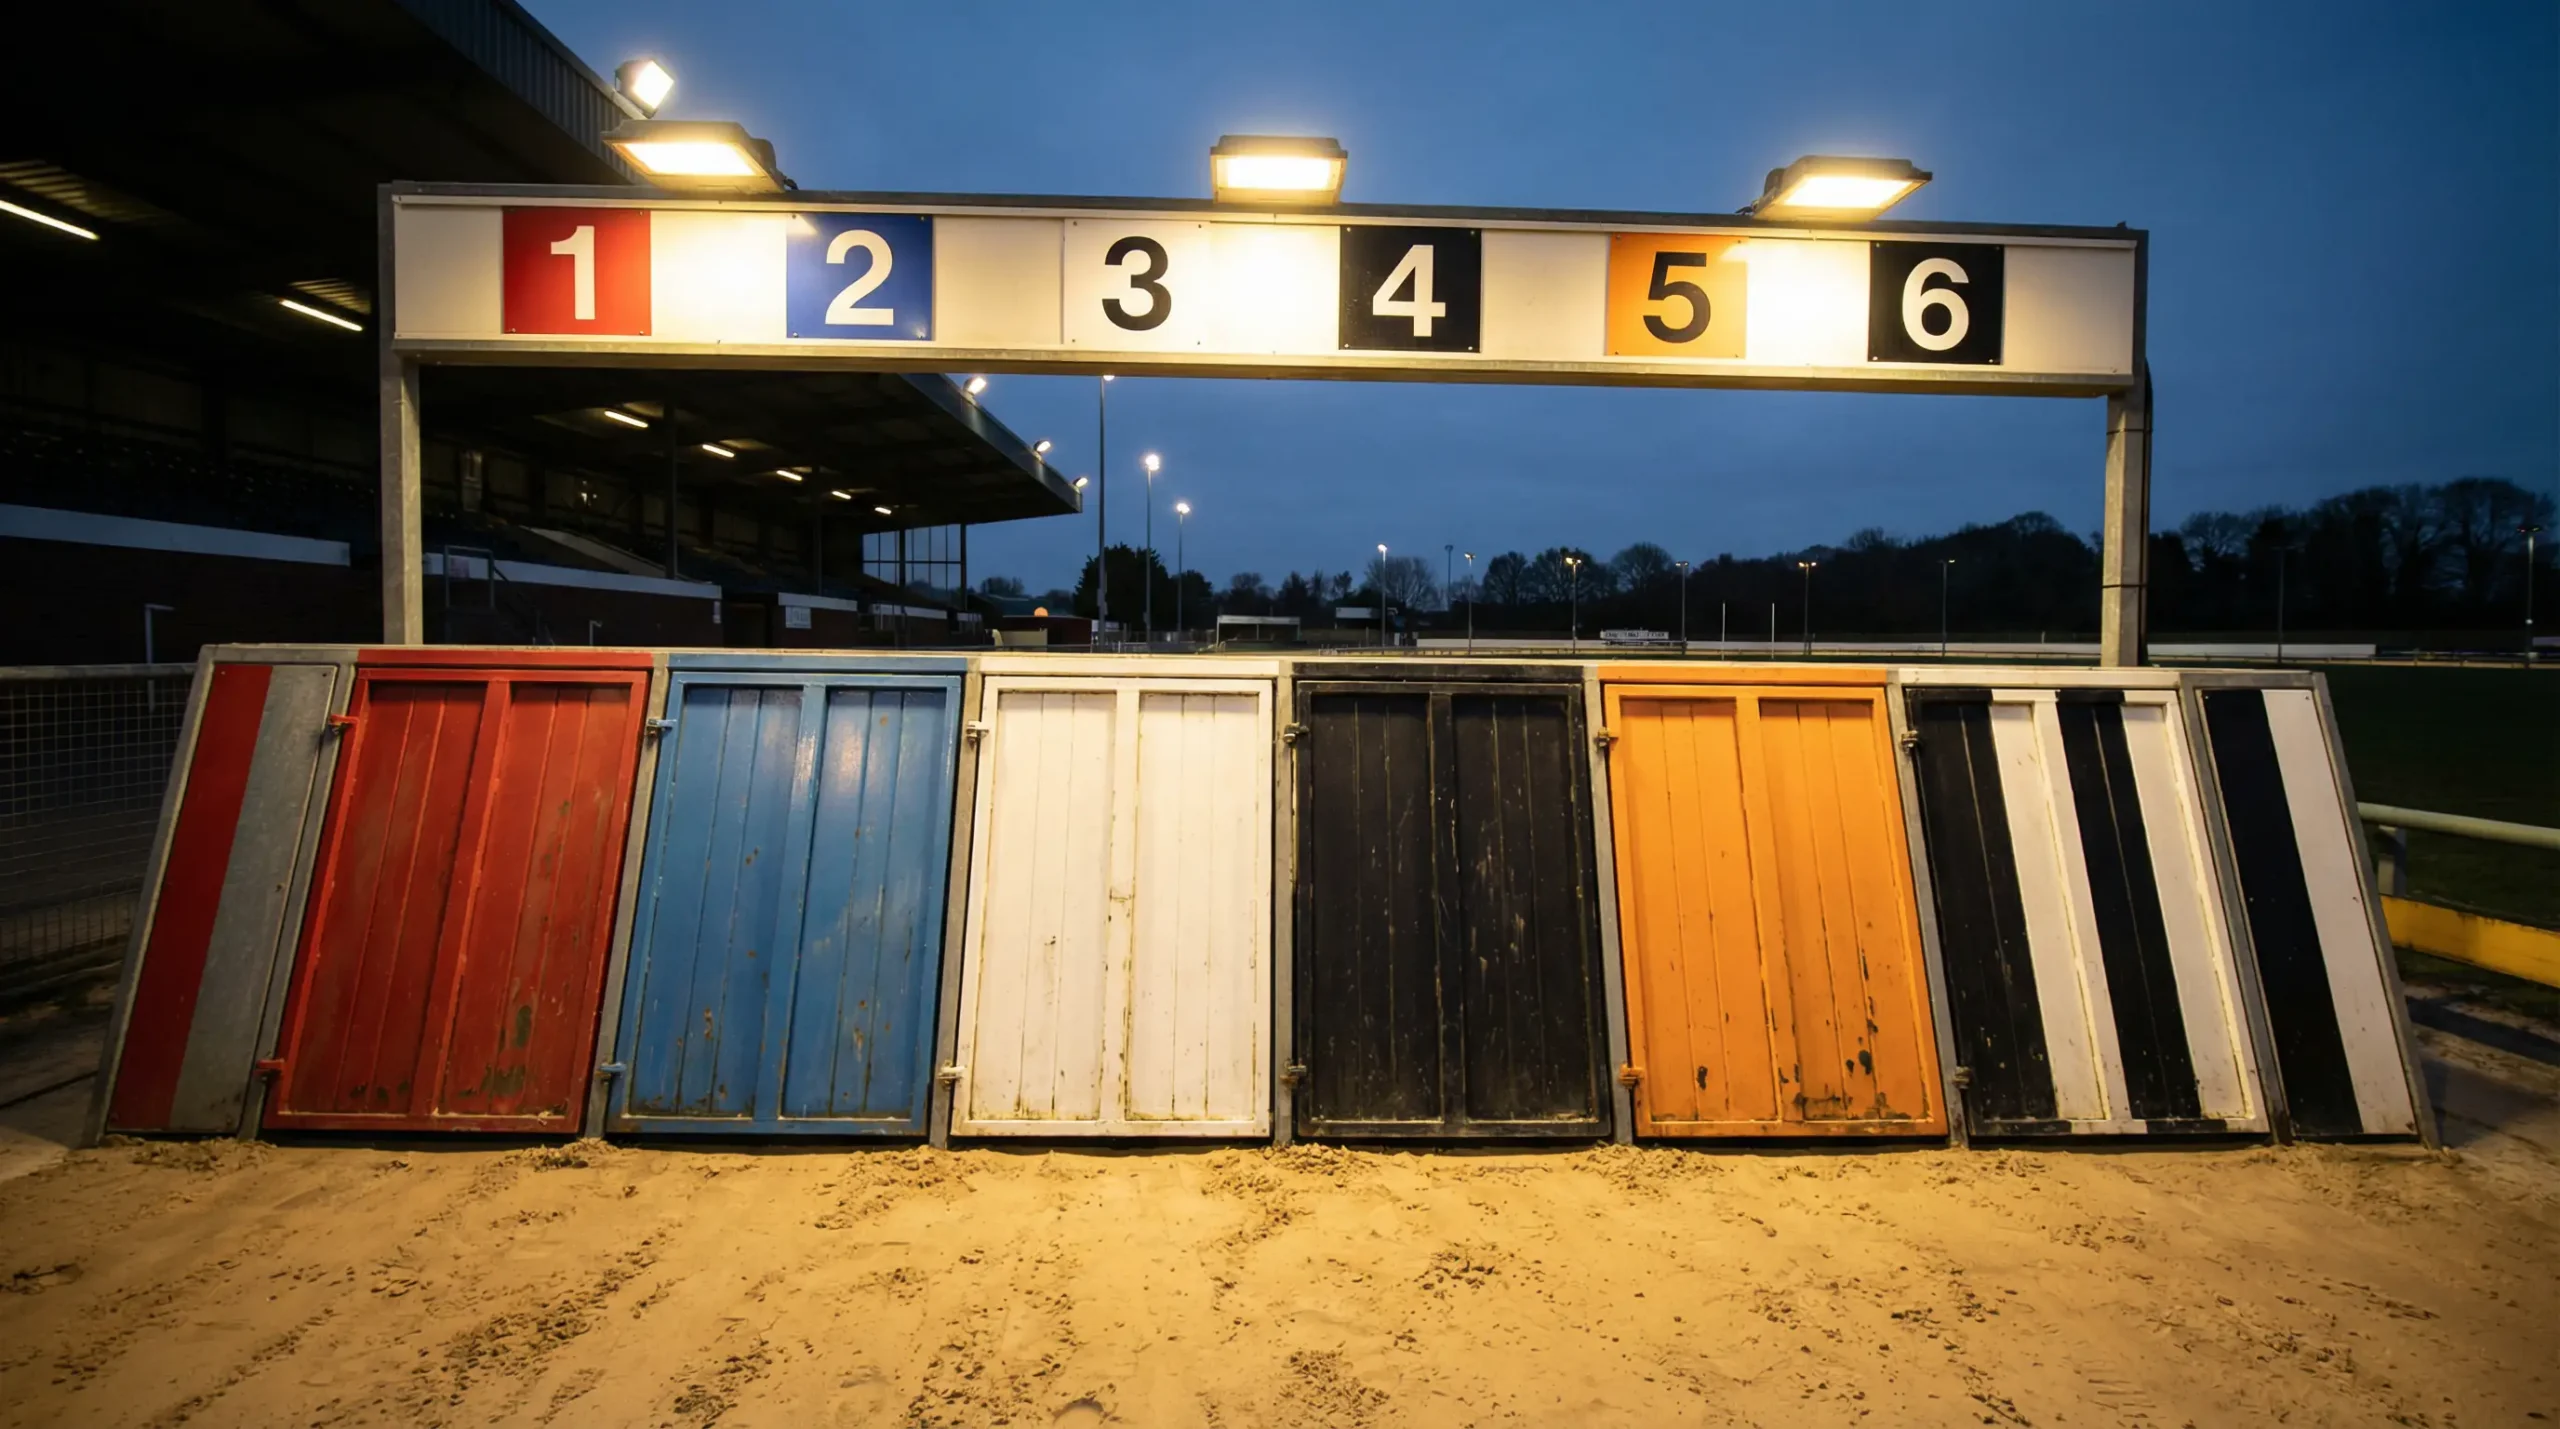
Every greyhound race in the UK starts from numbered traps — one through six, each assigned a coloured jacket. Most punters register the trap number, glance at the form, and move on. What they miss is that the trap a dog starts from has a measurable, statistically significant effect on its probability of winning. At some tracks, the gap in win rate between the best and worst trap exceeds ten percentage points. That is not noise or small-sample quirk. That is a structural advantage built into the geometry of the circuit.
Trap bias exists because greyhound tracks are not symmetrical from every starting position. The distance from the boxes to the first bend, the radius of the bends, the position of the hare rail, and the natural fanning pattern as dogs break from the traps all create persistent advantages for certain positions. In a race that lasts under thirty seconds, positional edges at the start compound rapidly — and the dogs drawn in favoured traps benefit from those edges night after night, year after year.
For punters, the implication is direct. If you are choosing between two equally rated dogs and one is drawn in a historically strong trap while the other sits in a historically weak one, the trap data provides a tiebreaker with real predictive power. If you are ignoring trap statistics entirely, the punters who use them are exploiting the gap in your analysis.
Trap Win Percentages Across UK Tracks
Across the licensed greyhound tracks in the UK, trap one wins more often than any other trap in aggregate. This is not coincidence — it reflects the fundamental advantage of the inside rail. The dog in trap one breaks closest to the rail and, with any early speed at all, establishes the shortest running line into the first bend. That positional advantage translates directly into a higher win rate.
Typical aggregate figures across UK racing show trap one winning approximately 19-21% of races, against a baseline expectation of 16.7% if all traps were equal. Trap six, the widest starting position, typically wins between 13% and 16%. The middle traps cluster around 15-18%, with trap two often performing slightly better than traps four and five.
These aggregates, however, conceal significant track-to-track variation. At tight circuits with short runs to the first bend — Romford is the textbook example — trap one dominance is extreme. The field reaches the bend within a few strides, and the inside dog has no time to be challenged for the rail. Trap one at Romford can win 23-25% of graded races over certain periods, making it a genuine betting indicator on its own.
At larger tracks with longer straights — Nottingham, Towcester — the bias flattens considerably. Dogs from the outside have more space and time to cross into favourable positions before the first bend arrives. Trap six can perform near the average at these venues, particularly in sprint races where raw early speed from any position is the decisive factor.
Hare type also influences the data. Tracks using an outside hare — where the lure runs along the outer rail — produce different bias patterns to those using an inside hare system. The outside hare draws dogs outward, which can benefit middle traps that get a clearer run while inside and outside dogs converge on the lure’s path.
The essential point: trap statistics must be assessed at the individual track level. Blanket rules about trap one being best are useful as starting assumptions, but the specifics at your particular track may tell a different story. The GBGB results archive and specialist sites like Greyhound Stats publish track-specific trap data by distance and grade. Using that data — not rules of thumb — is what separates analytical trap assessment from superstition.
How Track Layout Creates Trap Bias
Trap bias is geometry, not luck. Understanding the physical reasons behind the numbers gives you a framework for evaluating trap draw even at tracks where you lack detailed statistics.
The primary variable is the distance from the starting traps to the first bend. This run determines how much time the dogs have to sort themselves out before the bend forces them into compressed running order. A short run — under 50 metres — creates extreme bias because inside dogs are already positioned when the bend arrives. Outside dogs are still trying to cross inward and lose ground in the process. A long run — 80 metres or more — gives outside runners time to find position, and the bias flattens.
Bend radius matters too. Tight bends favour inside runners because the physics of cornering at speed make the inside line significantly shorter. On a compact 380-metre circuit, the difference between the rail and a line two or three wide through the bends can amount to several lengths over the full race. Wider, more sweeping bends reduce this differential and allow outside runners to maintain speed through the turns.
Track circumference ties these variables together. Smaller tracks tend to have shorter runs to the bend and tighter turns, producing stronger inside-trap bias. Larger tracks have longer straights and gentler geometry, producing flatter trap statistics. It is not a perfect correlation — design details vary — but it serves as a reliable starting framework for any track you encounter.
The position of the traps relative to the bend also plays a role. At some tracks, the boxes sit well back on the straight. At others, they are closer to the curve. The angle of approach into the first turn differs depending on this placement and can create unexpected advantages for middle traps at certain venues.
Using Trap Bias in Your Betting Decisions
The most effective use of trap bias is as a filter, not a standalone strategy. Trap data alone does not pick winners — it tells you which dogs have a structural edge and which are working against the track’s geometry. Combined with form analysis, running style, and grade context, it becomes a tiebreaker that consistently tilts marginal decisions in your favour.
The simplest application: when two dogs have comparable form, favour the one drawn in the statistically stronger trap. This is elementary, but the number of punters who back a dog purely on recent results without considering whether the trap draw supports that form is remarkably high. A dog with two recent wins from trap one now drawn in trap six at a tight track is not the same proposition — and the market does not always adjust fully for the change.
The second application is identifying mispriced dogs. A runner with decent but unspectacular form drawn in the most favourable trap at a track with strong bias might be priced at 4/1 or 5/1 based on form alone. But the trap advantage adds a probability layer that the form figures do not capture. These are the situations where trap-aware punters find consistent small edges that the wider market overlooks.
The third application is negative selection — identifying dogs to oppose. A wide runner drawn in trap one at a tight track fights both its natural style and the geometry. A front-runner in trap six at a venue with a short run to the bend faces immediate crowding. These dogs may have the best form in the race on paper, but the trap draw creates a scenario where replicating that form is unlikely. Opposing them — by backing another dog or excluding them from forecast selections — is a productive use of trap analysis.
Building your own trap records takes time but pays dividends. Track the trap of the winner and placed dogs at your regular venues over several months, filtering by distance and grade. Current data reflecting actual conditions is more reliable than historical averages, which may have been influenced by different hare systems, resurfacing, or changes to starting positions. Your own data, gathered from your own observation, is the most trustworthy foundation for trap-based decisions.
The Geometry Edge: Traps, Bends, and Probability
Trap bias is one of the few factors in greyhound betting that is genuinely stable over time. Dogs come and go, form fluctuates with fitness and confidence, trainers have good months and bad months. But the track does not change shape between races. The bends that favour inside runners in the first race favour them in the last. The geometry that penalises trap six on Monday penalises it again on Friday.
This consistency is what makes trap analysis so valuable as a building block. It provides a fixed, repeatable data point that you can layer on top of volatile information from the form guide. It does not replace form, grade context, or running-style assessment. But it anchors your analysis to something structural — something that does not depend on how a dog feels on any given night.
The punters who take trap statistics seriously develop an automatic awareness of draw quality. They look at a race card and immediately register which dogs have favourable draws and which are fighting the track. The assessment takes seconds, requires no paid tools, and over hundreds of bets produces a cumulative edge that is small per race but meaningful over a full campaign.
Geometry does not have off nights. When the data says trap one at your track wins 22% of the time, it means the other five traps are sharing the remaining 78%. Incorporating that structural reality into every bet you place is not optional for serious punters — it is the foundation beneath everything else.